This weekly blog post and its host website cover a wide variety of Fred Montague's environmental commentaries, gardening topics, and wildlife/art activities. Please browse the website and the blog archives for topics you are interested in.
This post is a follow-up to my last one-- providing a way to discover for yourself the important signals of global warming, even as it is happening.
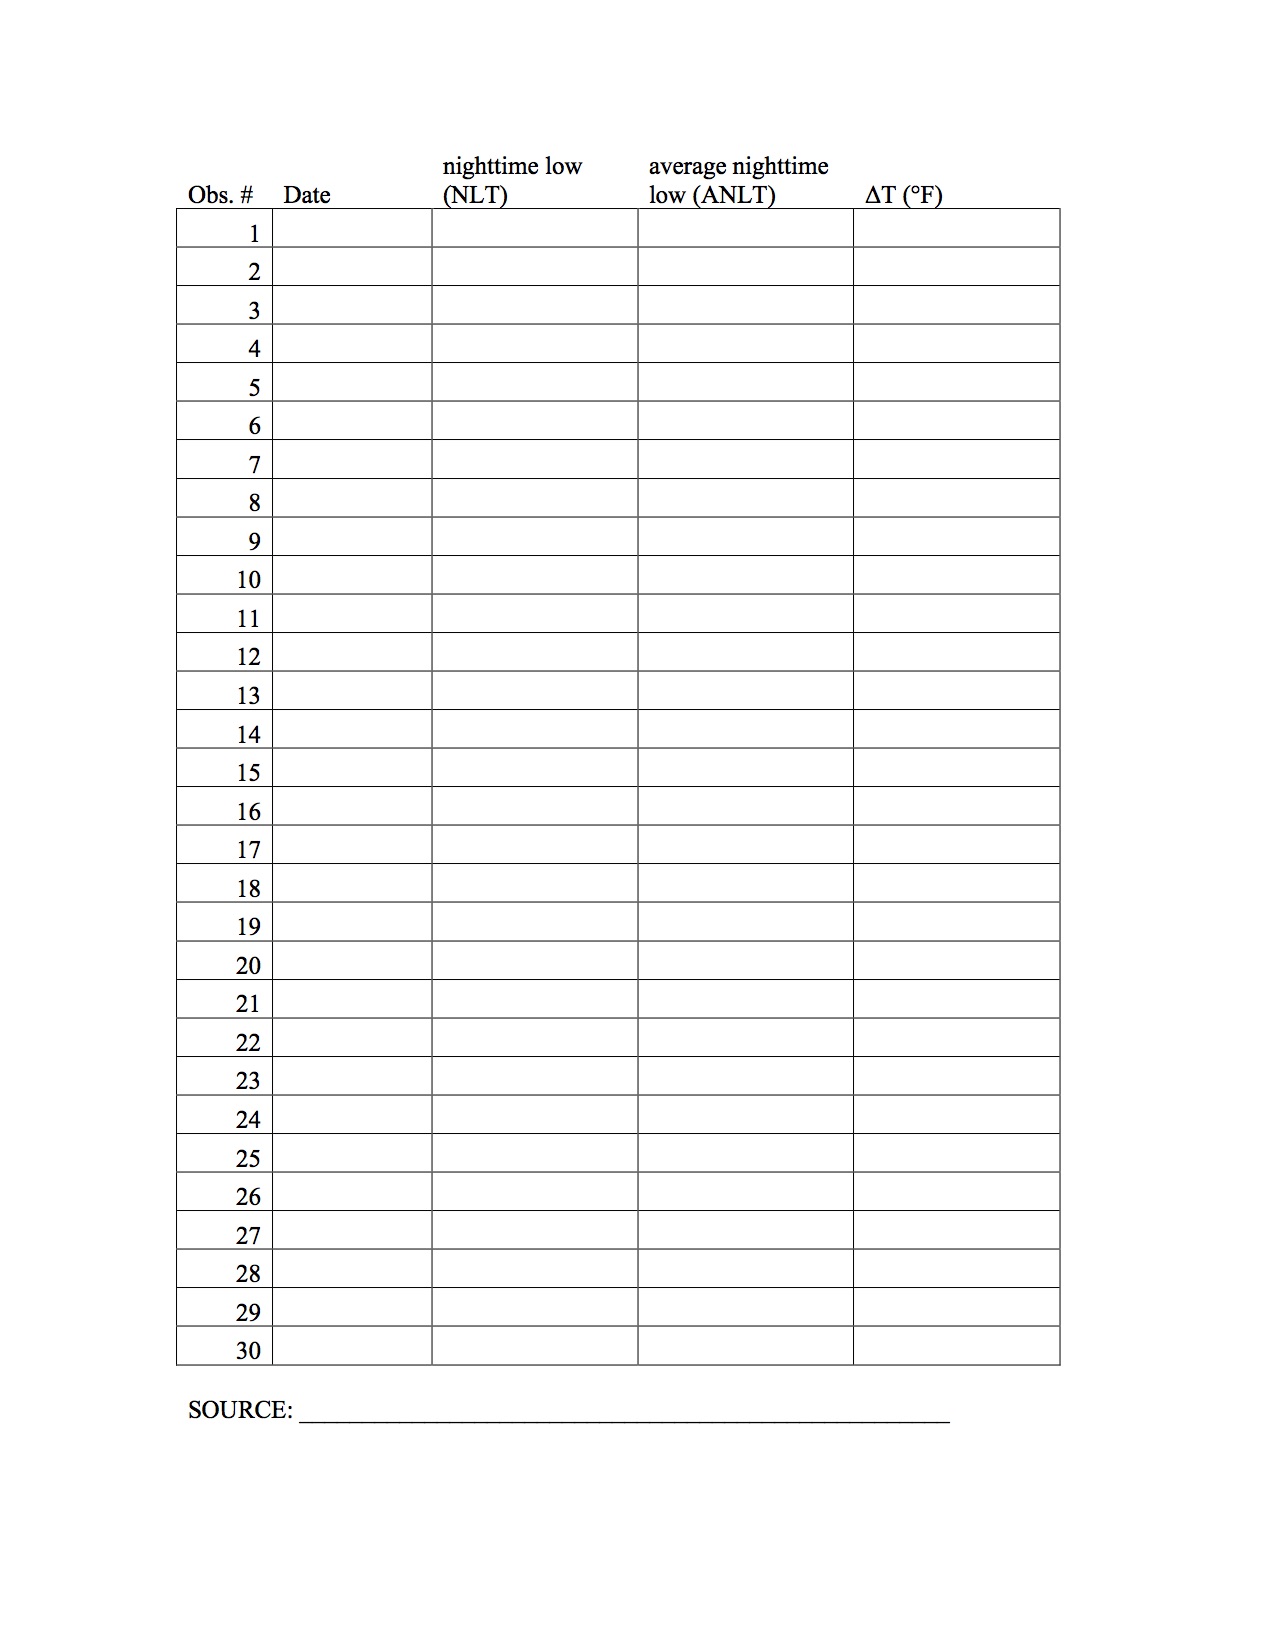
I have provided (below) the actual assignment and data recording sheet that I used in my environmental science classes at the University of Utah.
Please download the materials and have fun collecting the data. The analysis will likely be more serious.
BIOL 3460 (Montague)
Exercise: Investigating Climate Change
Climate is "average weather." In order to begin to understand the controversy regarding climate change (and global warming) we will collect and analyze some data.
Assignment:
1. For the next 30 days collect the following information and record it in the table provided below. Information required: Daily observations of nighttime low temperature (NLT) and the average nighttime low temperature (ANLT) for a specific local weather station. You could obtain this information from any of the following sources: A local radio or television news/weather program or a local daily newspaper or a web site that provides daily weather observations (e.g., http://www.wrcc.dri.edu, http://gbdash.dri.edu). Whichever source of information you select, you must use the same source for all 30 data entries.
2. For each observation, calculate ΔT (the difference between NLT and ANLT). Construct a graph and plot the 30 observed values for ΔT. Your graph may be one of various forms. Try different approaches. Pay attention to which is the dependent variable and which is the independent variable.
3. Answer the following questions.
What is the "average" nighttime low based on?
What is the null hypothesis in this exercise?
After 30 days, what are your tentative conclusions based on the evidence you collected?
What analyses did you perform to arrive at your conclusions? Did you add the number of days of above normal, normal, and below-normal nighttime temperatures? Did you add all of the lower-than-normal ΔT's and all of the higher-than-normal ΔT's and compare the sums? Etc.?
What are the limitations of this exercise with respect to revealing change or stability?
How many days of observations of "weather" would we need to assess "climate?" How about 100 days? How about 1,000 days (2.7 years)? How about 10,000 days (27 years)? Could you work back in time?
What will you have actually measured if you did this for 10,000 days?
To learn more about widespread (global) climate change, could you enlist the help of college students at every North American university (or every university in the world)? --or every thinking citizen with a TV?
Do local TV meteorologists suspect that above-average nighttime low temperatures are a "fingerprint" of global warming? On a commercial TV station, what would prevent a meteorologist from explaining his/her interpretation of the science he/she reports daily?
Once again, why are we interested in nighttime low temperatures?

