This Week's Post: Climate Change Letter to Congress from 31 Major Scientific Societies

This weekly blog post and its host website cover a wide variety of Fred Montague's environmental commentaries, gardening topics, and wildlife/art activities.  Please browse the website and the blog archives for topics you are interested in. 


Climate Change Letter to Congress from 31 Major Scientific Societies

This week's post consists of a copy of a letter sent to the United States Congress earlier this summer from 31 of our preeminent scientific organizations.  The letter represents the majority opinion of the thousands of members of the entities listed as signatories. 

The scientific community overwhelmingly agrees that unprecedented rapid climate change is happening and that human activity is the principal cause.  This community of scholars also includes the several thousand scientists contributing to the Intergovernmental Panel on Climate Change (IPCC) assessment reports and the Millennium Ecosystem Assessment

There has never been a challenge confronting humanity that has such widespread global scientific support.

This Week's Post: Climate Change and Biome Shifts

This weekly blog post and its host website cover a wide variety of Fred Montague's environmental commentaries, gardening topics, and wildlife/art activities.  Please browse the website and the blog archives for topics you are interested in. 


This Week's Post: Climate Change and Biome Shifts

There are many reasons why global climate change poses significant challenges for humans.  The pages reproduced below are from my hand-lettered textbook Wa-Maka-Skan:  Fundamentals of Wildlife Ecology and Conservation.

Figure 2 on the page below ("Major Biomes of North America") shows the observed link between two major climate features, mean annual precipitation and mean annual temperature, and the occurrence of major vegetational communities.

As our industrial civilization changes the climate, the new temperature and precipitation patterns become less favorable for biomes as they are currently distributed.  Climatologist Stephen Schneider says, 'biomes find themselves stranded in the wrong climate.'   The existing vegetation will die, beginning on the southern and northern edges of its range, and different plant communities will begin to emerge.  Even with rapid climate change, this transition will take hundreds of years in most cases.

These biome shifts have widespread consequences for agriculture, forestry, groundwater recharge, river flow, biodiversity and a host of other taken-for-granted benefits that we receive from a relatively stable Nature. 

Grassland areas become warmer and drier as they shift toward desert communities.  This is important for humanity since our major agricultural regions occur in grassland biomes.  Shifting agriculture northward (in the northern hemisphere) as grasslands migrate north into formerly forested areas is problematic because the forest soils (that developed under forests) are less well-suited for the crops we depend on.

In ecosystems (and even in engineered systems), change is destabilizing. My generalized biome map on the second page shown below will have to be revised in the year 2500.


majorbiomes_no_am
generalized_biomes_no_am

This Week's Post: More on investigating climate change

This weekly blog post and its host website cover a wide variety of Fred Montague's environmental commentaries, gardening topics, and wildlife/art activities.  Please browse the website and the blog archives for topics you are interested in.


This post is a follow-up to my last one-- providing a way to discover for yourself the important signals of global warming, even as it is happening.

I have provided (below) the actual assignment and data recording sheet that I used in my environmental science classes at the University of Utah.

Please download the materials and have fun collecting the data.  The analysis will likely be more serious.


BIOL 3460 (Montague)
Exercise: Investigating Climate Change

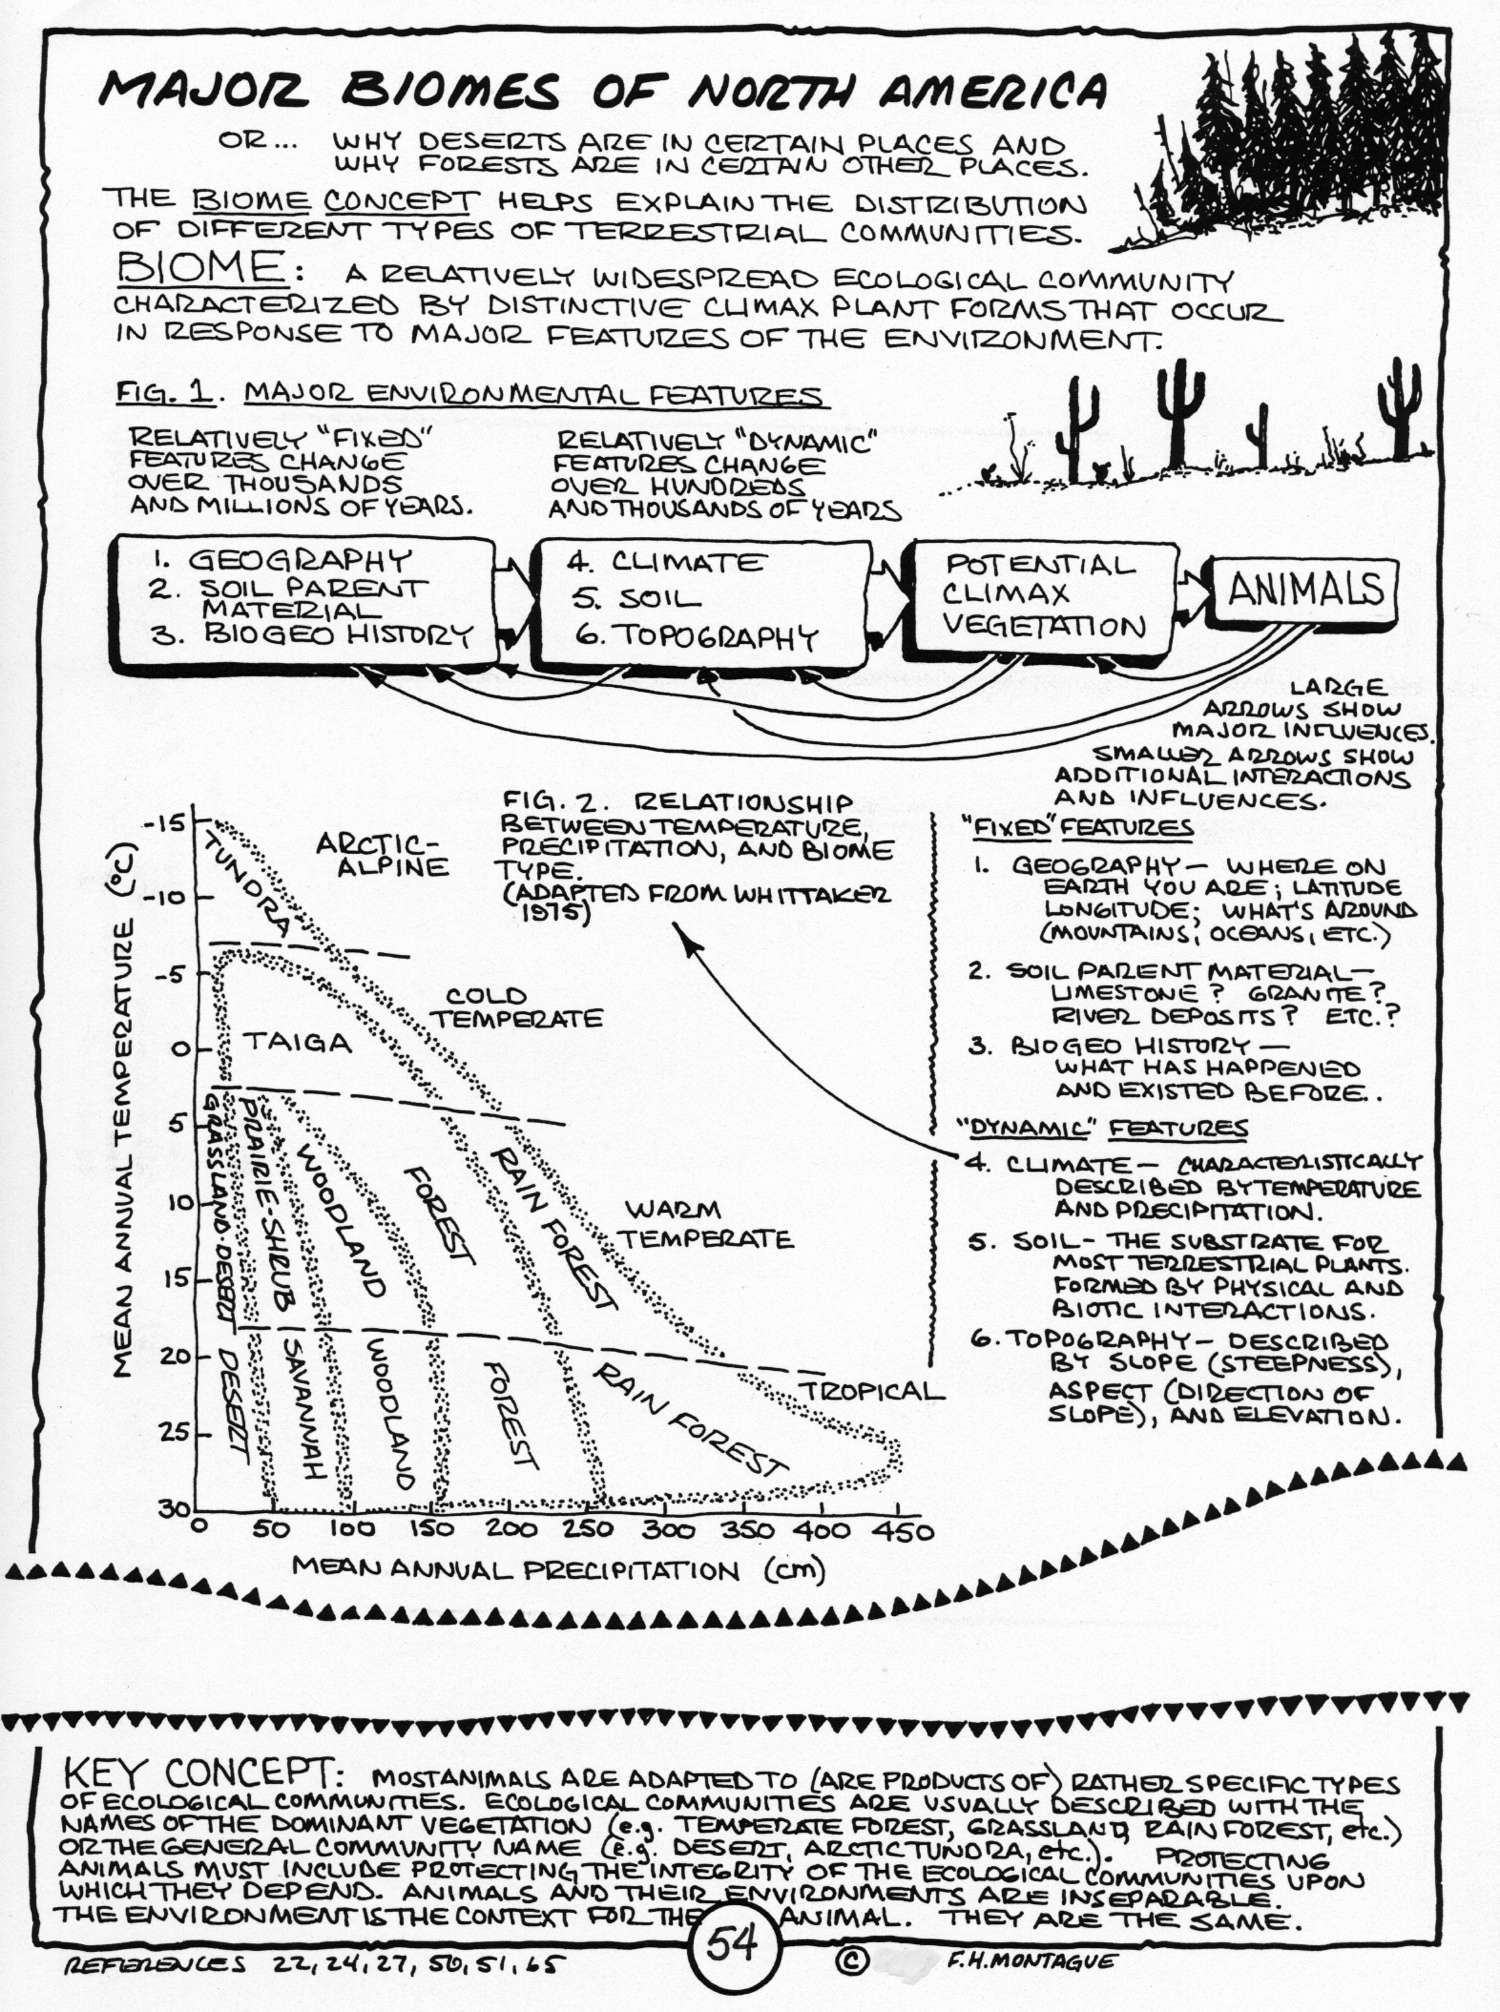
Climate is "average weather." In order to begin to understand the controversy regarding climate change (and global warming) we will collect and analyze some data.

Assignment:

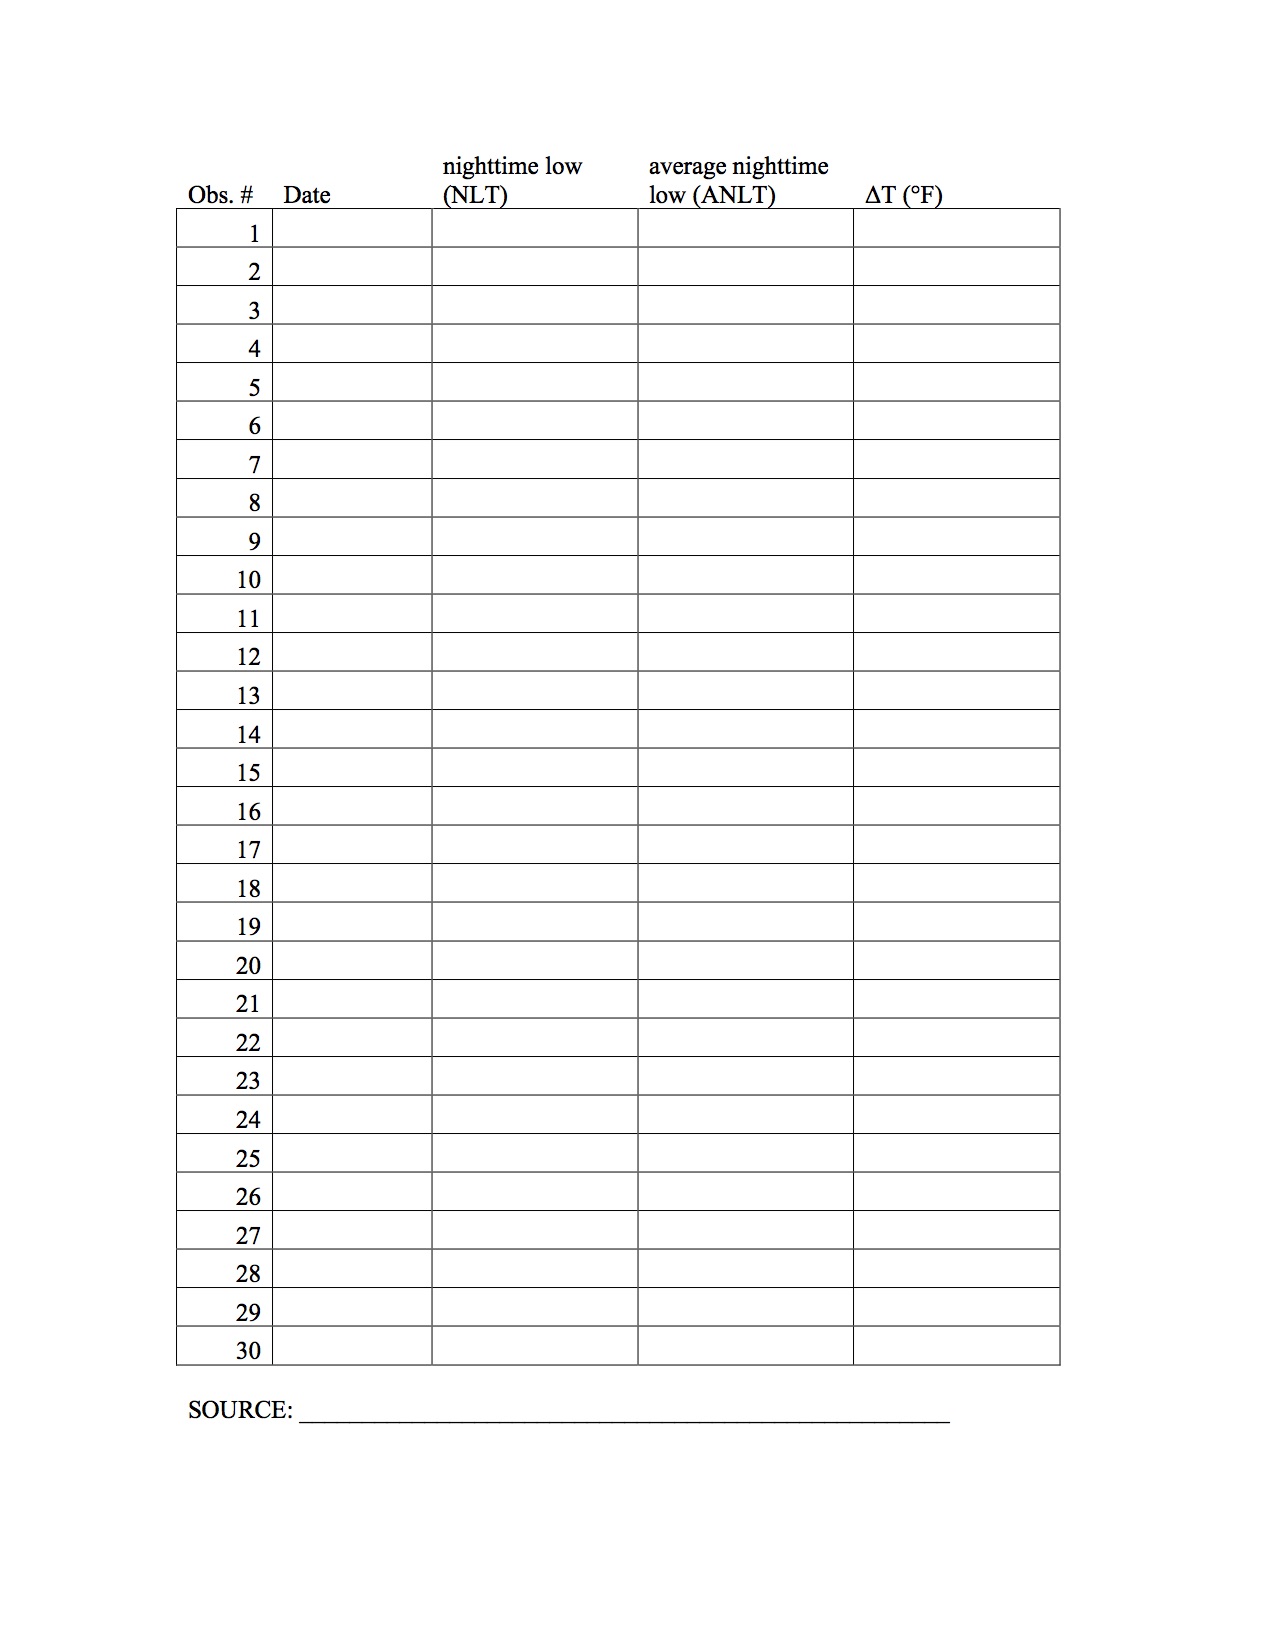
1. For the next 30 days collect the following information and record it in the table provided below. Information required: Daily observations of nighttime low temperature (NLT) and the average nighttime low temperature (ANLT) for a specific local weather station. You could obtain this information from any of the following sources: A local radio or television news/weather program or a local daily newspaper or a web site that provides daily weather observations (e.g., http://www.wrcc.dri.edu, http://gbdash.dri.edu). Whichever source of information you select, you must use the same source for all 30 data entries.

2. For each observation, calculate ΔT (the difference between NLT and ANLT). Construct a graph and plot the 30 observed values for ΔT. Your graph may be one of various forms. Try different approaches. Pay attention to which is the dependent variable and which is the independent variable.

 3. Answer the following questions.

What is the "average" nighttime low based on?

What is the null hypothesis in this exercise?

After 30 days, what are your tentative conclusions based on the evidence you collected?

What analyses did you perform to arrive at your conclusions? Did you add the number of days of above normal, normal, and below-normal nighttime temperatures? Did you add all of the lower-than-normal ΔT's and all of the higher-than-normal ΔT's and compare the sums? Etc.?

What are the limitations of this exercise with respect to revealing change or stability?

How many days of observations of "weather" would we need to assess "climate?" How about 100 days? How about 1,000 days (2.7 years)? How about 10,000 days (27 years)? Could you work back in time?

What will you have actually measured if you did this for 10,000 days?

To learn more about widespread (global) climate change, could you enlist the help of college students at every North American university (or every university in the world)? --or every thinking citizen with a TV?

Do local TV meteorologists suspect that above-average nighttime low temperatures are a "fingerprint" of global warming? On a commercial TV station, what would prevent a meteorologist from explaining his/her interpretation of the science he/she reports daily?

Once again, why are we interested in nighttime low temperatures? 

temperature_data_table

This Week's Post: Climate Change Homework Assignment

This weekly blog post and its host website cover a wide variety of Fred Montague's environmental commentaries, gardening topics, and wildlife/art activities.  Please browse the website and the blog archives for topics you are interested in. 


Climate Change Homework Assignment

Here's a topic for every fifth-grader's science fair project.  Or, if you are a "climate change skeptic" or if you would like to challenge your friends who are, this is a simple exercise.

Background:  We know that the Earth's pre-industrial atmosphere contained certain trace gases that absorb heat energy.  During the daytime, the sun warms half of the planet as it rotates on its axis.  At night, some of the absorbed warmth is reradiated back into space.  Without the atmosphere's greenhouse effect, all heat energy would be lost to space and the Earth would be very cold-- less than 32 degrees F.  Water would be frozen and life as we know it could not exist.

So, the natural greenhouse effect created by water vapor, carbon dioxide, and a few other gases keeps the Earth a comfortable temperature for the life that has evolved over the past 3 billion years.

Since the industrial era began in the 1800's, however, humans have enhanced the natural greenhouse effect by emitting billions of tons of carbon dioxide, and by land use practices (plowing, forest cutting) that limit the Earth's capacity to absorb (sequester) some of the released carbon dioxide.  As a consequence, the atmospheric greenhouse has become more and more effective in trapping re-radiated heat energy.  This brings us to the homework exercise.

The Assignment:  Since the atmospheric greenhouse works primarily at night, by absorbing some of the heat energy absorbed the preceding day, nighttime low temperatures are trending above average.  This warming trend becomes apparent to anyone who pays attention to their local weather reports. 

For the next 30 days, record your local nighttime low and the average nighttime low. 

The null hypothesis(for your science fair project) is 'the actual and the average nighttime lows will not be significantly different over the 30-day period.'

Note:  The average nighttime low for your area is based on a 30-year record, and it is updated every 5 years. You might have to find a weather information source that reports an "almanac" that gives nighttime low averages for that date.

If you believe 30 days is too few data points, try 60 days or 90 days or a year.  If you search the weather/climate records for the last 10 or 100 years, you won't have to collect your own current date.

TV and radio weather presenters know about this trend, but due to commercial considerations on commercial stations, never mention it.

Environmental Commentary: "Heading for the Cliff"

Here's another page from my sketchbook of graphical visualizations of environmental issues-- climate change again.​

The top figure (I) shows humans shifting our living conditions to another state, a warmer environment. The sphere rolling uphill represents the human enterprise heading for conditions for which it is not immediately adapted-- abnormal conditions. And for an operation tailored to normal conditions, abnormal conditions are problematic.​ This scenario assumes that we immediately stop emitting from any source carbon dioxide that exceeds the Earth's capacity to sequester it. In other words, our net additions of carbon dioxide to the atmosphere are ZERO. This is not likely, despite the fact that we are the most "highly educated" and "technologically advanced" gang of humans ever to have existed.

The lower figure (II)​, under current conditions of concern and commitment, is a more likely possibility. There is only so far we can push the current array of multicellular organisms (mostly plants, fungi, and animals) into an environment for which they are not adapted. By the way, humans are multicellular organisms.

Of course there are probably more possibilities. Can you think of any?

"​Climate warming possibilities" from the sketchbook. © Fred Montague

"​Climate warming possibilities" from the sketchbook. © Fred Montague

From the Sketchbook: Another Way to Visualize Global Change

Here are more brainstorming exercises to help visualize stability and change.​

Images 1 and 2 depict two stability states, one robust and one tenuous.​

Image 3 seems (to me) to be a reasonable representation of our current circumstances.​

Images 4 and 5 are a bit more ominous (especially image 4) because they suggest abrupt changes. For large organisms and complex cultures adapted to relatively stable conditions, abrupt change is troublesome.​

​Ways to visualize stability and change, plate 1. © Fred Montague
Ways to visualize stability and change. © Fred Montague

Ways to visualize stability and change. © Fred Montague

From the Sketchbook: Change

Here's an example of what started to be a sketchbook exercise-with-letters turning into an environmental science commentary.​

In the context of evolved systems and engineered systems, change is destabilizing.​

This was a perennial final exam question in my environmental science/environmental issues classes at the university.​

I rationalized that the correct explanation for students was that currently thriving evolved systems (such as ecological communities, global climate systems, etc.) are the products of a period of relatively stable conditions.​ ​ Yes, change happens continually, but usually on small scales and of short durations. Beyond the range of benign, creative change, drastic change is destabilizing. And the greater the change, the more extensive the change, and/or the more rapid the change, the more destabilizing the change is.

The logic of the concept is demonstrated in a simple experiment with a familiar engineered system. The next time you take your internal combustion car in for an oil change, make a change. Have the mechanic drain the oil from the crankcase and replace it with coolant. Have him drain the coolant from the cooling system and replace it with oil. This represents a change from the normal conditions. See if it affects the car's performance; see if this change destabilizes the engineered system..

Now, on a larger scale, we could see if we could destabilize the Earths's climate system by increasing the concentration of carbon dioxide in the atmosphere by 35%. For the planet, this experiment, in its effect, is similar to the exercise with the car. The big difference is that most people have more sense than to drive a car with no coolant, but those same people don't understand the effect of their activities on the energy balance of the planet. We have reached the 35% increase mark and are heading for 50%.

Dramatic change is not the end of the world for all organisms- just for those that were adapted to the "relatively stable" previous conditions.​

Unfortunately, the playfulness of the graphic (below) downplays the seriousness of the concept.​

"​Change is destabilizing" graphic. © Fred Montague

"​Change is destabilizing" graphic. © Fred Montague


Environmental Science Classroom: Climate Change & Soil Moisture

We humans are largely dependent on plants grown on land-- cropland.  Our most important croplands are the planet's former grasslands, typically located in the middle of continents: the U. S. Great Plains, the steppes of Eurasia, the pampas of South America, etc.​

The essential climate-derived ingredient required to grow crops anywhere on land is soil moisture.​ Except in times of extreme drought, I doubt if many of us dependent on plant food (with the exception of farmers) ever think about soil moisture.

Below is an illustration I prepared that links climate change (as predicted by scientific models and as borne out by the experience of the last few decades) with soil moisture. The prediction that continental interiors will be warmer and drier is particularly significant.​

You can use your imagination to link soil moisture with what's on your dinner plate.​

​Diagram showing relationships between climate change and soil moisture. © Fred Montague

​Diagram showing relationships between climate change and soil moisture. © Fred Montague


Environmental Science Classroom: Climate Feedback Loop 1

I have recently posted two "climate feedback loop" fact sheets. One described the ice/albedo feedback and the other discussed the methane loop. These are examples of positive feedback (or runaway feedback), effects that tend to amplify climate change.

The feedback effects shown below deal with humans causing an increase in the amount of water vapor in the atmosphere.​  Here are two positive feedback loops (increased water vapor and increased cirrus clouds) and one negative feedback loop that tends to counteract global warming (the formation of low, thick, stratus clouds that reflect sunlight). There is uncertainty about which types of clouds will form, but it is likely that both are possibilities, depending on meteorological conditions.​

​Climate Feedback I: Water Vapor. © Fred Montague

​Climate Feedback I: Water Vapor. © Fred Montague

Environmental Science Classroom: Recommended Reading (The Long Thaw)

David Archer is professor of geophysics at the University of Chicago. His 2009 book The Long Thaw: How Humans Are Changing the Next 10,000 Years of Earth's Climate, places our current human-caused climate event in the context of the Earth's geologic record. This short, well-written, and sometimes amusing account carefully explains the inadvertent, yet significant, climate impacts of our actions that vaporize a long-buried geological resource (fossil fuels) and in short order release its combustion products into the atmosphere.

Here are Archer's first two sentences (and a fragment) in the prologue:  "Global warming could be one of humankind's longest lasting legacies. The climatic impacts of releasing fossil fuel CO2 to the atmosphere will last longer than Stonehenge. Longer than time capsules, longer than nuclear waste, far longer than the age of human civilization so far."

The book's contents.

 Prologue: Global Warming in Geologic Time. Chapter 1: The Greenhouse Effect. Chapter 2: We've Seen It with Our Own Eyes. Chapter 3: Forecast for the Century. Chapter 4: Millennial Climate Cycles. Chapter 5: Glacial Climate Cycles. Chapter 6: Geologic Climate Cycles. Chapter 7: The Present in the Bosom of the Past. Chapter 8: The Fate of Fossil Fuel CO2. Chapter 9: Acidifying the Ocean. Chapter 10: Carbon Cycle Feedbacks. Chapter 11: Sea Level in the Deep Future. Chapter 12: Orbits, CO2 and the Next Ice Age. Epilogue: Carbon Economics and Ethics.

The 180-page paperback version's ISBN is 978-0-691-14811-3.

The cover of the book The Long Thaw by David Archer.

Environmental Science Classroom: Climate Feedback Loops 3 & 4

Here is another unintended effect of our greenhouse gas emissions.  (See the January 4, 2013 post for feedback loop 2.)

Both of the global warming feedback loops shown below involve the potential release of hundreds of millions of tons of methane, currently frozen in tundra soils and shallow ocean sediments.

On a molecule-for-molecule basis, methane is 30 to 70 times more effective than carbon dioxide at trapping heat in the atmosphere.

In an exhibit of chemical irony, after about 12 years in the atmosphere, the methane molecules degrade (oxidize) into carbon dioxide and water vapor-- both important greenhouse gases.

Climate feedback loops 2, 3, & 4 are all positive feedbacks (or runaway feedbacks) and tend to amplify (rather than counteract) the effects of human greenhouse emissions.

Climate Feedback Loops 3 & 4 (methane). © 2013 Fred Montague

Climate Feedback Loops 3 & 4 (methane). © 2013 Fred Montague

Environmental Science Classroom: 116-year U. S. Annual Temperature Trend

The graph shown below was downloaded from the U. S. National Oceanic and Atmospheric Administration's National Climatic Data Center website. It includes a summary of temperature records for weather stations in the lower 48 states over the span of time that reliable records have been kept (1895 - present).

The dense black horizontal line (A) represents the 116-year average temperature for the lower 48 states. The gray line (B) represents the temperature trend over the same period. It reveals an overall warming of 1.392 degrees F.

Be cautious about the "average temperature line." It serves merely for reference as the 116-year average.  As the average changes with each year's additional data, this line will go up or down, depending on the new average.  If I were printing the average line, I would have it be a dotted line.  The "trend line," on the other hand, is a smoothed plot of the 116--year net change.

To project this trend forward to 2050 (just 37 years from now) would be to predict a mid-century U. S. average warming of 1.86 degrees F (from 1895 until 2050). If we consider the positive feedback loops that we are discussing (see January 4, 2012 post), there is good reason that the warming will be greater.

If you visit the NCDC website, you can generate 116-year temperature (and precipitation) plots for any state, region, or individual weather station (usually cities, towns, and government facilities).  This could be the basis of a school (or university) term paper or science project. The availability of these data enable everyone to study climate change and monitor global warming.

Graph showing annual average temperature over time in the contiguous U.S., 1895-2011. Generated at NCDC website, accessed January 2nd, 2013.

Graph showing annual average temperature over time in the contiguous U.S., 1895-2011. Generated at NCDC website, accessed January 2nd, 2013.

Environmental Science Classroom: Climate Feedback 2

In public discussions about climate change, even among us Americans who understand that it is happening and who acknowledge that we are causing it, the topic usually is limited to carbon dioxide emissions from burning fossil fuels-- coal, oil, and natural gas.  These are the sources for more than 85% of all commercial energy that we use in the U.S. 

By adding carbon dioxide to the atmosphere, we enhance the Earth's greenhouse effect.  The result is that the Earth's atmosphere absorbs heat that normally would be  re-radiated into space.  This is well understood by climate scientists and most others.

What most folks don't know or haven't been told about are the several climate feedback loops that are being set in motion by our planet-warming carbon emissions.  The illustration below briefly explains one of the more apparent feedback mechanisms, the ice-albedo feedback loop.

If most people understood this "run-away" feedback effect, we would probably conclude that even the most drastic emission-limiting proposals are woefully inadequate to deal with the problem of global change.  Here are summaries of three popular approaches that have been advanced by people who care. These have mostly been dismissed as too drastic.

1. We should reduce our carbon emissions to 80% of current levels by 2020.  Or pick any percentage or any year.

2.  We should stabilize atmospheric carbon dioxide concentrations at 350 ppm. Or pick any concentration.

3. We need to be carbon-neutral by 2050.  Or pick any date.

By understanding the climate feedback loops one might conclude that an even more radical approach is necessary-- we must become carbon-negative yesterday.  This means that we immediately emit no more carbon at all and start planting trees to temporarily sequester some of the atmospheric carbon dioxide in plant tissue.  (Of course, we must also revolutionize our land-use strategies.)

These change-enhancing feedback loops take on a life of their own. So, if we stabilize the greenhouse effect today at present levels, the warming and ice-melting trend will continue which will cause more warming and ice-melting, etc. The loop will disappear only after there is no more ice and snow on the planet and after the climate is warm enough that no more snow falls and no ice forms.

We hear from scientists and other observers that global warming is happening faster than predicted.  Most of the predictions have not included feedback loops.

The ice/albedo feedback loop is just one of several that we will discuss later.

Ice/Albedo Feedback Loop Diagram by Fred Montague. © 2012
Ice/Albedo Feedback Loop Diagram by Fred Montague. 

© 2012

Environmental Science Classroom: Recommended Reading

Full Planet, Empty Plate: The New Geopolitics of Food Scarcity.  Lester Brown.  2012. W.W. Norton & Co., N.Y. 144 pp. pbk.  ISBN 978-0-393-34415-8

Lester Brown, President of Earth Policy Institute, is one of the great big-picture thinkers and communicators of our time.  As the latest in his Plan B series (Plan B, Plan B 2.0, Plan B 3.0, Plan B 4.0, and World on the Edge), Full Planet, Empty Plate outlines in concise and compelling logic the deteriorating condition of the world's food system.  Chapter 1 opens with the sentence: "The world is in transition from an era of food abundance to one of scarcity."  And in the chapters that follow, Brown outlines the challenges humanity faces in the next few decades with respect to growing food.  

The contents:

1.  Food: The Weak Link

2.  The Ecology of Population Growth

3.  Moving Up the Food Chain

4.  Food or Fuel?

5.  Eroding Soils Darkening Our Future

6.  Peak Water and Food Scarcity

7.  Grain Yields Starting to Plateau

8.  Rising Temperatures, Rising Food Prices

9.  China and the Soybean Challenge

10. The Global Land Rush

11. Can We Prevent a Food Breakdown?

Full Planet, Empty Plates by Lester R. Brown

Read Full Planet, Empty Plates and then begin to think of ways of addressing any one of these important issues. The book is available in hard copy or as a free download from the Earth Policy Institute. Or order from your neighborhood book shop.